

Reasons to be Fearful, Reasons to be Cheerful, part Three*

In Reasons to be Fearful, reasons to be Cheerful, part One we addressed the first question in the Haddam Road Three Question Focus, “What is going on in the economy?”:
https://tinyurl.com/FearfulCheerfulPart-1
Part Two addressed “What is going on in the financial markets?”:
https://tinyurl.com/FearfulCheerfulPart-2
Here in part Three we’ll highlight some things to be aware of in your portfolios and the potential risks involved going forward, namely:
Convexity and bonds
Market Liquidity
Forthcoming Volatility
Convexity: Bonds offer the prospect of “Return-free Risk”**
Jim Grant, publisher of 'Grant’s Interest Rate Observer', coined the term ‘return-free risk’ a few years ago to describe the bond market; the term has never been more pertinent.
What does that mean? One simple way to describe it: bonds are curvy.
For example, in July the US Treasury had an auction for bonds maturing in 30 years, if you bought that issue you paid the US Treasury $1,000 and will receive $13.30 a year in interest ($6.65 every 6 months to be precise). A Subway sandwich every six months? That’s the “return-free” part….
Risk? Take a look at the graph below for a better perspective:

Source: Author
This graph shows what this bond is worth at different interest rate levels (otherwise known as the “Current Yield”). Notice the curving of this line, the level of ‘curvy-ness’ is called convexity and that is the essential point here. As rates go lower, bond prices go up at an increasing rate. That was the return boosting part… bond convexity. If you’ve held bonds for the last 30 years you’ve benefited from this convexity, but now you’re in the ‘bond stratosphere’ and what does that mean for your portfolio?
Over the interest rate cycle of the last 30-40 years a 60% stock / 40% bond portfolio has benefited from that curvy-ness, holding bonds was great because your bonds increased at an increasing rate as interest rates dropped and you received income for holding them. Beautiful! Your bond portfolio was an excellent counterweight to your stock portfolio.
But where are we now? Interest rates are artificially low thanks to the Federal Reserve’s Zero-interest-rate policy (ZIRP) and accordingly bonds are priced up in the stratosphere (the “you are here” point on the graph above).
Bonds were great for your portfolio when prices were going ‘up the hill’, but they will look ugly going ‘down the hill’. Very little chance for profit, very large risk of loss. That’s the risk part. Do you want to hold stuff like this for a $13.30 yearly reward? Any whiff of inflation will start us down that hill.
The ‘well-diversified portfolio’ of the last 40 years is not necessarily diversified anymore.
Equity valuation
In part Two we highlighted certain eye-wateringly high equity valuations (like a certain car maker whose stock price fell 33% recently) and how ZIRP has skewed assets valuation across this marketplace.
Stocks are super-high, bonds are super-high, what is driving this? Federal Reserve liquidity. How does this movie end? There was a prequel in 2018.
Liquidity: When the ‘Lender of last resort’ is the main provider of liquidity, markets are not liquid.
We’ve highlighted the herculean efforts the Federal Reserve has made to stabilize markets in the last 6 months; they have ballooned their balance sheet See below) and consequently this institution has become counterparty to a massive section of this market. What happens when they try to exit this function? They’ve already tried it once, and things did not go well.
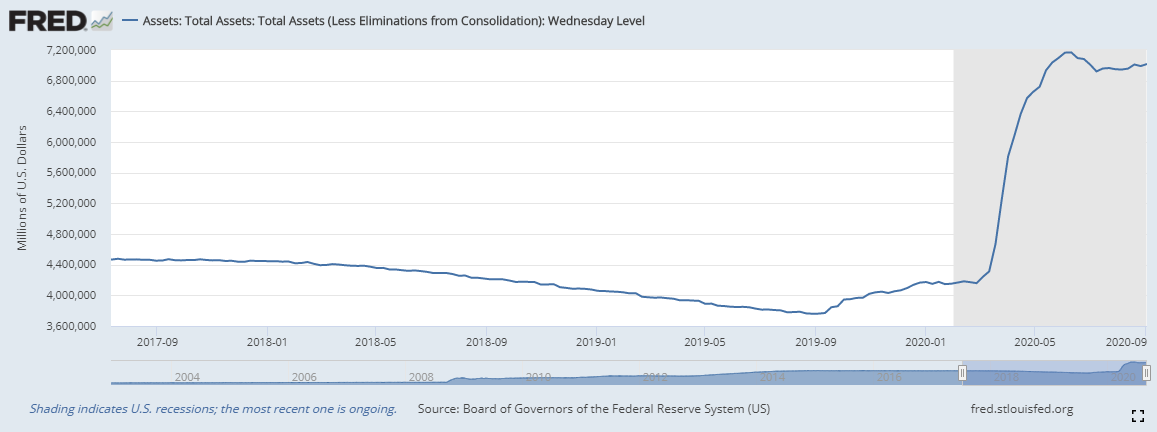
https://fred.stlouisfed.org/series/WALCL
See the slight down slope in 2018? In the third quarter of 2018 the Fed announced they would systematically reduce their holdings and did so by about 10% while slightly increasing rates. That slight restriction of liquidity caused the S&P to plummet 18% in eight weeks. Now the balance sheet is twice as large, what will happen when the Fed changes course?
The graph of the S&P 500 below best illustrates the point above:

Source: https://finance.yahoo.com/quote/%5EGSPC?p=%5EGSPC and author
The dramatic move up in equities this summer directly corresponds to the absolute explosion in the Fed balance sheet; very supportive of markets and, given the pandemic response, appropriate at the time. But where and when is the exit from this policy? There is no indication that will happen any time soon, but eventually there will be a change that will bring on the next point:
Mitigating the Forthcoming Volatility
Markets have experienced an exceptional run-up this summer after a sensational meltdown this spring. It’s apparent even after the events of the past few weeks… it ain’t over. The first five years of this decade could very well define the global path for the next century there may be tremendous upheaval with great opportunities and great dangers. How do you manage your precious capital during this forthcoming volatility?
The most neutral strategy: Cash
A higher cash balance is a prudent parking spot in times of turbulence. It feels horrible to hold it when markets rocket skyward, but offer great comfort when markets return to earth. A proper allocation strategy will be selling as markets rise, generating a cash balance, and will look to allocate that cash when markets move lower. There is low risk, but no reward and any inflationary pressures will reduce your purchasing power. Again, working with an advisor can give a better perspective as to how much cash to hold.
Reducing bond Duration
We showed what convexity looks like above, how does one reduce that risk? Duration is a measure of a bonds interest rate sensitivity, reducing duration lowers price sensitivity.

Source: Author
The blue line is our friend the 30 year bond; the orange line is the latest 2 year US Treasury bond with a 0.15% coupon. The 2 year bond moves much, much less as interest rates change (as shown above) but for $1,000 you’ve paid you only receive $1.50 per year in interest for two years; yes, if you saved all the interest you receive over two years you still could not buy a Starbucks coffee. Is that more attractive than cash?
Dividend paying stocks
I am a fan of dividend paying stocks from companies with solid financials mostly in defensive industries like food staples, utilities (where there are no wildfires), real estate (only in very select areas), and energy (specifically natural gas infrastructure companies). There is value here if one does their homework.
Sure, my clients still have exposure to technology and other high growth names but in this market but it’s becoming harder to justify holding a full allocation.
How can else can you ‘stay in the game’?
Commodities, specifically, Gold
Gold has been around for eons and has been held as a safe asset against political or economic mismanagement. One could make arguments for both or either form of mismanagement taking place at the moment so there may never be a better time this century to hold an allocation.
Hedging: consider volatility as an asset class
Hedging is a fancy term for finding things that go up when markets go down.
Here is a graph of a thing called the VIX (or Volatility Index), it shows how nervous market participants are over potential market events for the next eight months:

Source: http://vixcentral.com/
Generally speaking, this is a measure of the level of uncertainty in equity markets as measured by the level of option prices in the marketplace. See that bump? That’s a reflection of nervousness around the election in early November (by the way that’s the largest ‘bump’ ever shown on this graph for an election***).
It is also something that can be used to mitigate risk. What do I mean? Look below at the VIX index versus the S&P 500 stock index since March 1:

Source: Author and Hidden Levers
It’s been the definition of a hedge; it goes up when (green line) markets go down (blue line). This is an active strategy (and one that is used in Haddam Road’s portfolio management). Feel free to contact me to learn how this strategy works.
There are many reasons to be Fearful but there are also many reasons to be Cheerful regarding the future. This pandemic has heightened uncertainty but also has accelerated the implementation of new technologies and is creating new opportunities that can fundamentally change how we live and invest.
There is a high probability of increased volatility going forward and it is essential that you be aware of how your money is being invested. Time worn strategies, like a ‘60/40 portfolio’, are not as safe as they once were and capital preservation is essential in the short term to prepare for a possible second technological golden age going forward. Where? In blockchain, genetics, energy, communications, and transportation. Great opportunity will appear after this period of danger.
I enjoy working with clients who want to understand their finances and be actively involved in shaping their future. Please email me at brian@haddamroad.com if you have any questions or comments. Change Happens. Let us be there for you in managing your precious capital through that change.
Brian Kearns, CPA
Haddam Road Advisors
Financial Planner / Portfolio Manager
1603 Orrington Ave
Suite 600
Evanston, IL 60201
Ph: 312 636 3067
www.haddamroad.com
NOTE: This is being provided for informational purposes only and should not be construed as a recommendation to buy or sell any specific securities. Past performance is no guarantee of future results and all investing involves risk. Index returns shown are not reflective of actual performance nor reflect fees and expenses applicable to investing. One cannot invest directly in an index. The views expressed are those of Haddam Road Advisors and do not necessarily reflect the views of Mutual Advisors, LLC or any of its affiliates.
Investment advisory services offered through Mutual Advisors, LLC DBA Haddam Road Advisors, a SEC registered investment adviser.
*Thank you Ian Dury and the Blockheads for a song that always makes me smile: 'Why don't you get back into bed?, Reasons to be cheerful one two three... Elvis and Scotty, day's when I ain't spotty, sitting on the potty, curing smallpox...'. Poetry.
** ‘You are here’ image: https://www.ofcconference.org/en-us/home/exhibit-at-ofc/sponsorship-and-promotional-opportunities/you-are-here-floor-plans/
*** https://finance.yahoo.com/news/volatility-markets-brace-election-drama-100000689.html
